
The Partition Problem
Update (November 12, 2021):
Apparently, I’m not the only person who has ever stumbled into this problem and wondered if there was a better way.
Check out An Efficient Solution to Linear Partitioning for another take.
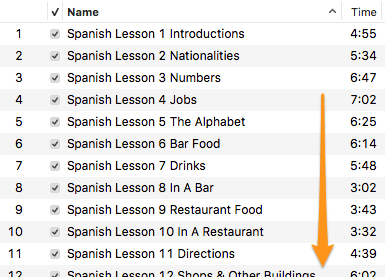
It started out with a seemingly simple real-life problem:
Given a playlist of sequential tracks, how do you divide it
in groups of similar durations?
I wanted to make 30-ish-minute groups; what I need for my daily Spanish practice.
It felt like a “solved problem”, I just needed to find some online “app” to do this…
Research
At that point, the last thing I wanted was to code this myself. Instead, I was willing to put in the time and do my homework.
I spent HOURS on this. To make a long story short:
- it’s a set partition problem
- it’s linear, the order matters
no good: listening to lesson 17 before lesson 2 - it’s discrete, the items cannot be subdivided
no good: stopping in the middle of a lesson - it’s similar to the partition problem
- it’s similar to the subset sum problem
- there were MANY almost-but-not-quite problems and algorithms
The closest thing I found was the linear partition from Skiena’s book though I found the explanation a bit opaque. He describes the problem as:
input: a given arrangement S of non-negative numbers and an integer k
output: partition S into k ranges, so as to minimize the maximum sum over all the ranges
Coding it, after all
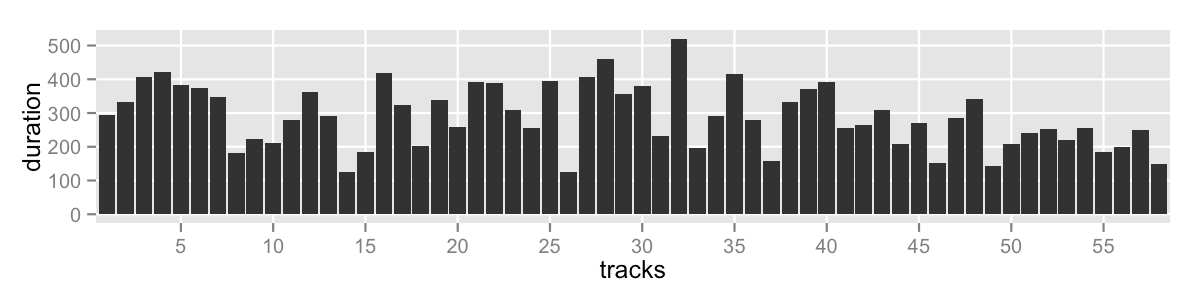
I never found a piece of software to which I could provide a list of numbers and how many parts I want. I decided to code it and try a few approaches. Here’s the data I’m working with and here’s what it looks like:
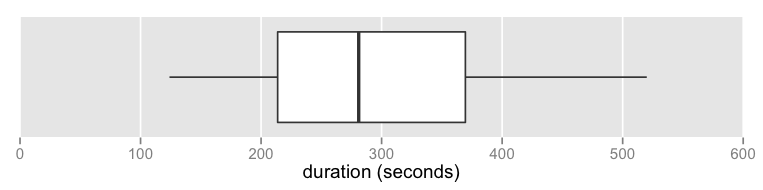
where the boxplot of the track durations looks like:
more details:
- 58 tracks
- range: 124-520s (2:04-8:40)
- mean: 290s (4:50)
- median: 281s (4:41)
- total duration: 16805s (4:40:05)
- no outliers
Methodology
The objective is to divide the tracks into groups that are “fair”. There shouldn’t be a “big group” or a “small group”, they should all be roughly equal. We want to minimize the spread of the group durations. The standard deviation is a good measure of spread, it’s also familiar and easy to calculate.
I came across the idea that minimizing the standard deviation really meant minimizing the sum of squares. Although correct and easier to calculate, I found that it was almost more abstract and in units I found hard to relate to. Consequently, the standard deviation is what I’m going to use to describe the “goodness” of my solutions.
For the sake of comparison, I’ll try to split the tracks into 10 groups – 9 groups made the average group duration over 30m and I’m still aiming for around 30m. I’ll come back to this point when I break into different number of groups later.
Simplest approach: same number of tracks in each group
Relevant code: count.R
This is not completely unreasonable, for tracks with similar durations, you might get good results by making groups with the same number of tracks. On the other hand, it doesn’t even look at the track durations, so it’s not using all the information available.
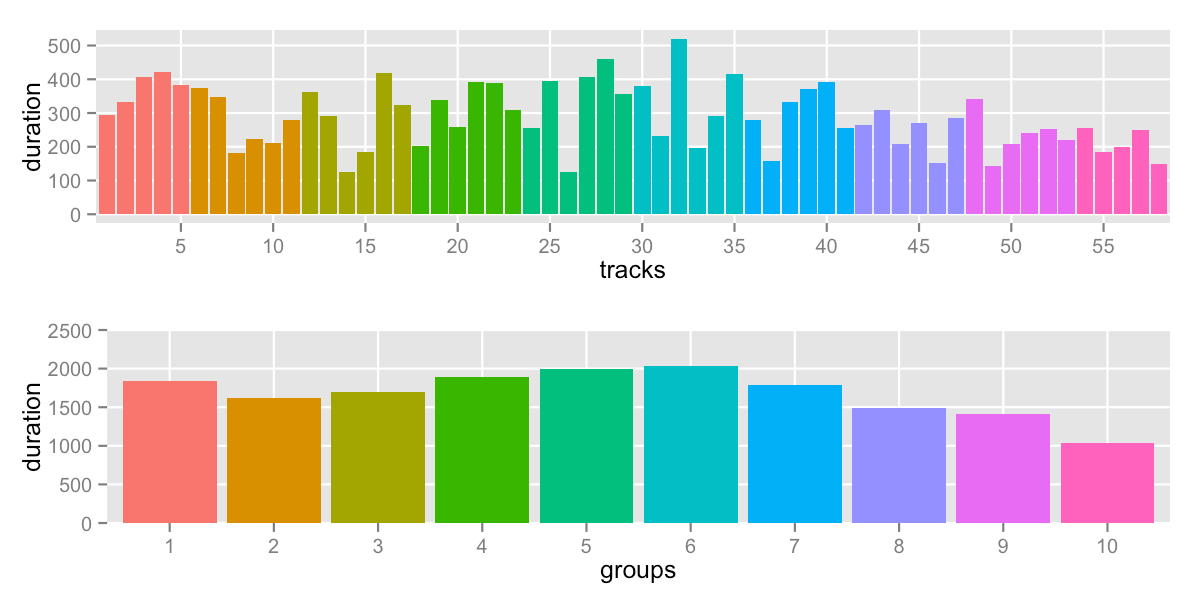
sd: 304.5 -- range: 1040-2035s (17:20-33:55)
Most groups have 6 tracks, some have 5 – that’s what you’d expect from breaking 58 tracks into 10. A lot of long tracks at the beginning and small tracks at the end give us a lot of variation between groups.
Let’s call this our baseline – clearly, we can do better.
Greedy approach: accumulate into a group until a maximum
Relevant code: cutoff.R
When I started thinking about the problem, it was the first solution that came to mind. Accumulate tracks in a group until around 30 minutes, then start a new group.
Using a cutoff of 1680.5 (total duration divided into 10 groups):
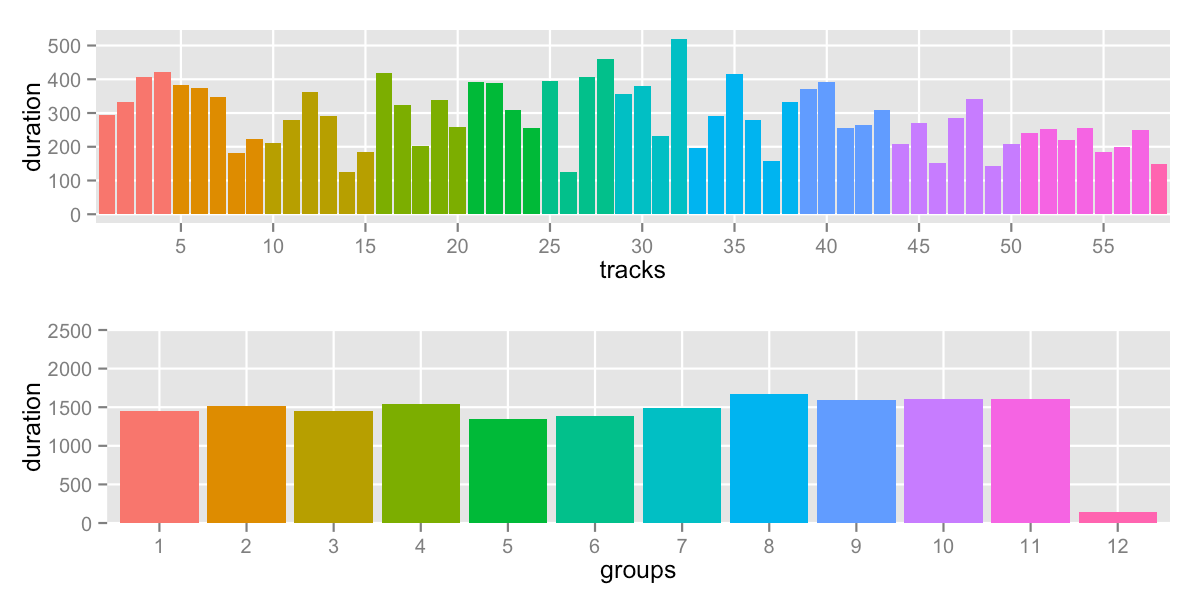
sd: 406.0 -- range: 148-1672s (2:28-27:52)
We can see many problems:
- we ended up with 12 groups – but maybe that’s not a deal-breaker
the choice of 10 groups was arbitrary anyway - last group is extreme, stuck with one leftover track
- on the plus side, the other groups at relatively even
This approach doesn’t rely on the number of groups, it has a specific cutoff to determine group membership. It’s possible to change the cutoff until you get a certain number of groups, or a lower standard deviation:
    cutoff buckets sd
    1500   13      288.9883
    1550   12      131.9025
    1600   12      131.9025
    1650   12      266.5167
    1700   12      406.5718
    1750   11      265.3115
    1800   11      270.0163
    1850   11      475.3502
    1900   10      245.7068
    1950   10      399.2165
    2000    9      145.1454
    2050    9      145.1454
    2100    9      145.1454
    2150    9      336.371
    2200    9      428.1255
    2250    8      149.2667
    2300    8      149.2667
    2350    8      434.7446
    2400    8      535.3405
    2450    8      535.3405
    2500    8      695.6937
The “best” attempt falls at cutoff is 2000:
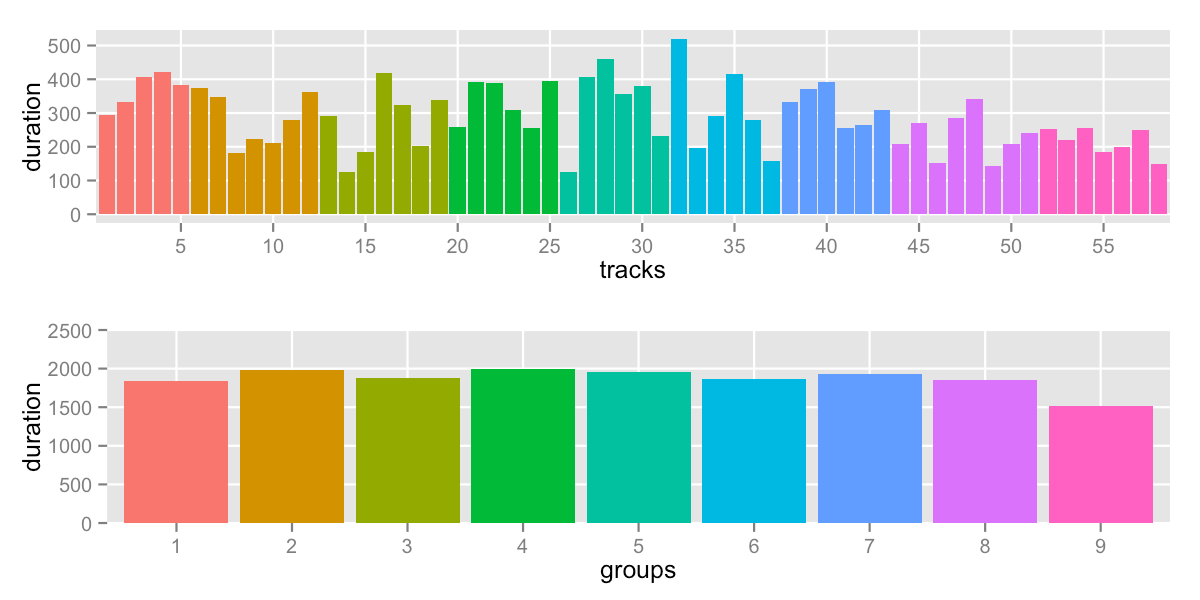
sd: 145.1 -- range: 1513-2000s (25:13-33:20)
It’s clear from that data above that the exact value of the cutoff has a big impact on the end result. If you’re willing to try multiple values looking for improvements, this algorithm might be enough for you.
But keep in mind that this algorithm makes no effort in looking at neighbor solutions which might be big improvements. For example, you could “even out” the last group by stealing some tracks from its neighbor. Then, you can repeat until … all groups level out.
Minizinc: letting the solver do its thing
Relevant code: partition.mzn
Although I enjoyed the Modeling Discrete Optimization class, I wasn’t sure that I would find a practical use for what I had learned. But Minizinc is designed to solve problems like this one – it is a language to describe constraints. You don’t have to write the search logic, that’s handled by a solver.
Above, I mentioned that Skiena’s algorithm was looking to “minimize the maximum sum over all the ranges”. I ran that and found:
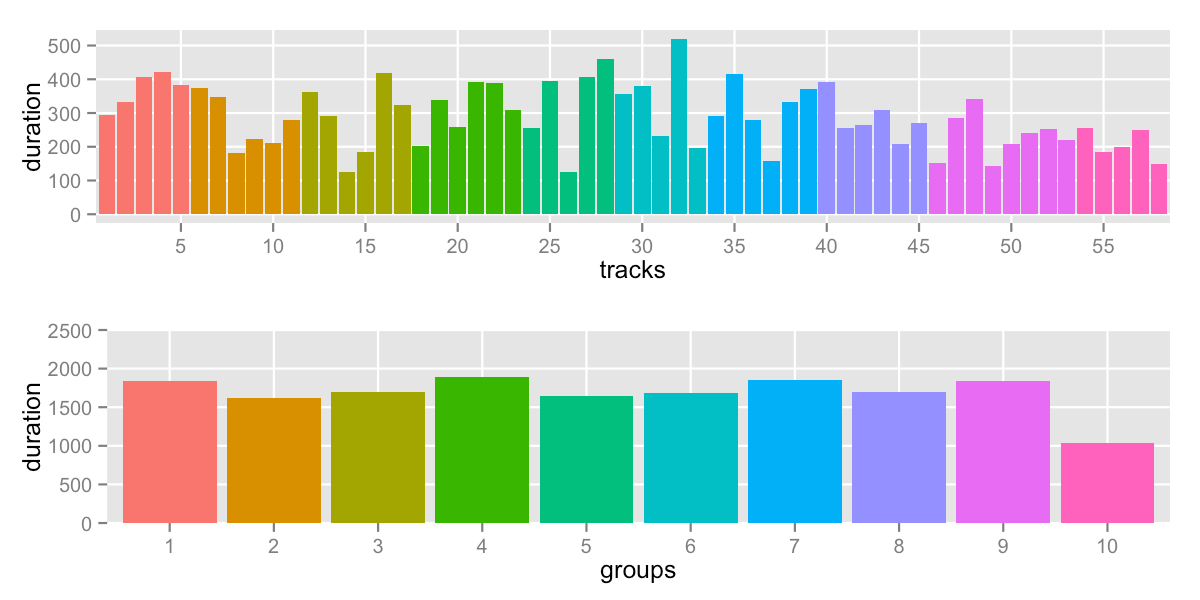
sd: 245.2 -- range: 1040-1892s (17:20-31:32)
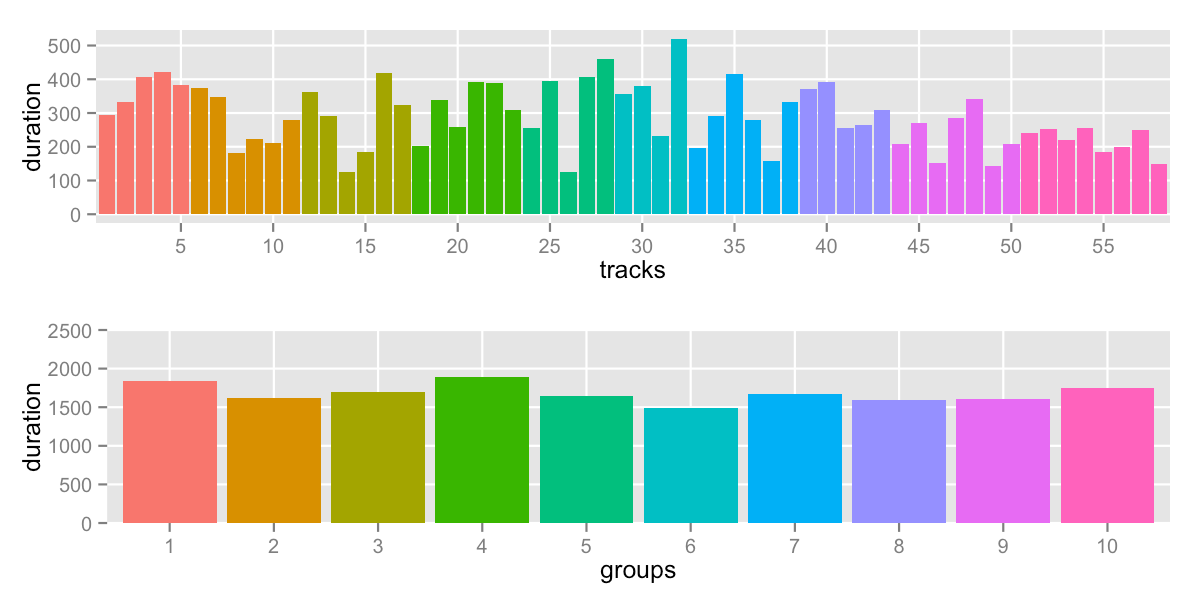
It’s pushing down on top values until they level out. It’s obvious looking at group 10 that the solver didn’t care
about the group values below the lowest max. We can immediately do better if we try to minimize max - min which
will push down the max AND pull up the min:
sd: 132.5 -- range: 1488-1892s (24:48-31:32)
The solver converges quickly. Even better, we didn’t have to write any complicated logic – the solver did all the work. But we know that the solver didn’t investigate the groups between the min and max. After all, all the values between min and max don’t change min and max. Depending on your data, you might land on the best answer – or tweaking the mid-groups might improve the standard deviation.
It would have been best to try to minimize the “sum of squares” (or the standard deviation) directly, but the non-linear nature of that problem prevented the solver from doing a good job. The solver got lost, and I couldn’t find a way to guide it with my current Minizinc skills.
The water flow way: inspired by nature
Relevant code: water-flow.R
If you imagine all the groups as containers filled with water and connected by pipes, you would only have to open the valves for all the containers to find their level. In the discrete case, it means that a whole track flows from one container to the next.
I decided to experiment with a simple algorithm:
- start from some initial state
- pick the biggest group
- send a track to one of its neighbor group
- goto 2
It’s not exactly how water flows, but it’s inspired by it. Always picking the
biggest group bypasses the case where I could pick a group smaller than both
its neighbors. I can code this function, call optim in R in simulated annealing (“sann”)
mode to keep repeating the process.
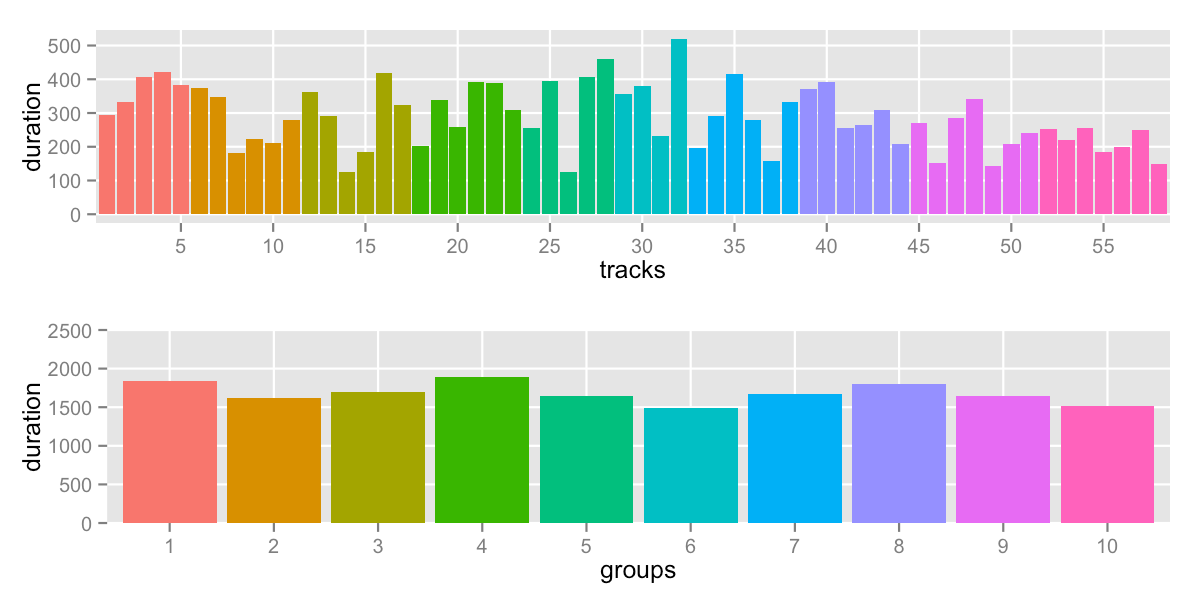
sd: 120.9 -- range: 1488-1892s (24:48-31:32)
The range didn’t change compared to the Minizinc version because the min and max didn’t change. However, the algorithm did a better job at smoothing out group 8, 9 and 10.
I was surprised how well this simple algorithm worked in practice. I had expected it to get bogged down based on initial conditions, but that didn’t happen even with extreme initial conditions. This might be dependent on the exact data – your mileage may vary. Maybe it’s best to start the algorithm with something “almost right”, something like the output of one of the other method above.
Durations and Number of Groups
Now that we have a workable algorithm to reduce the spread of the groups, we can come back to question of how many groups would be ideal.
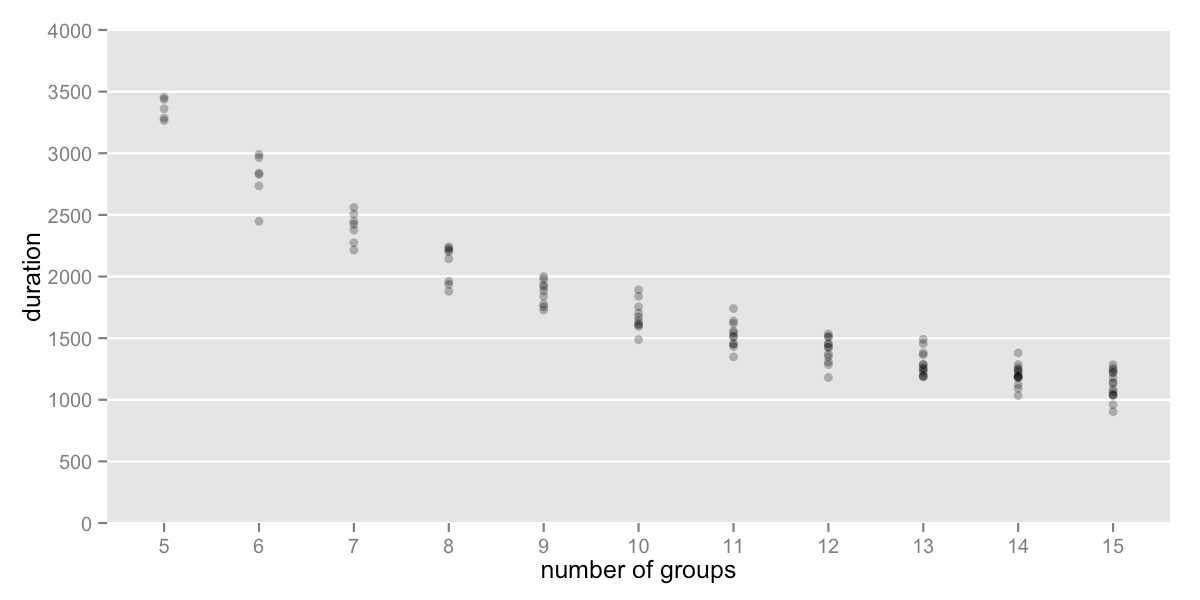
To stay under 30m (1800s), I would divide the tracks into 11 groups.
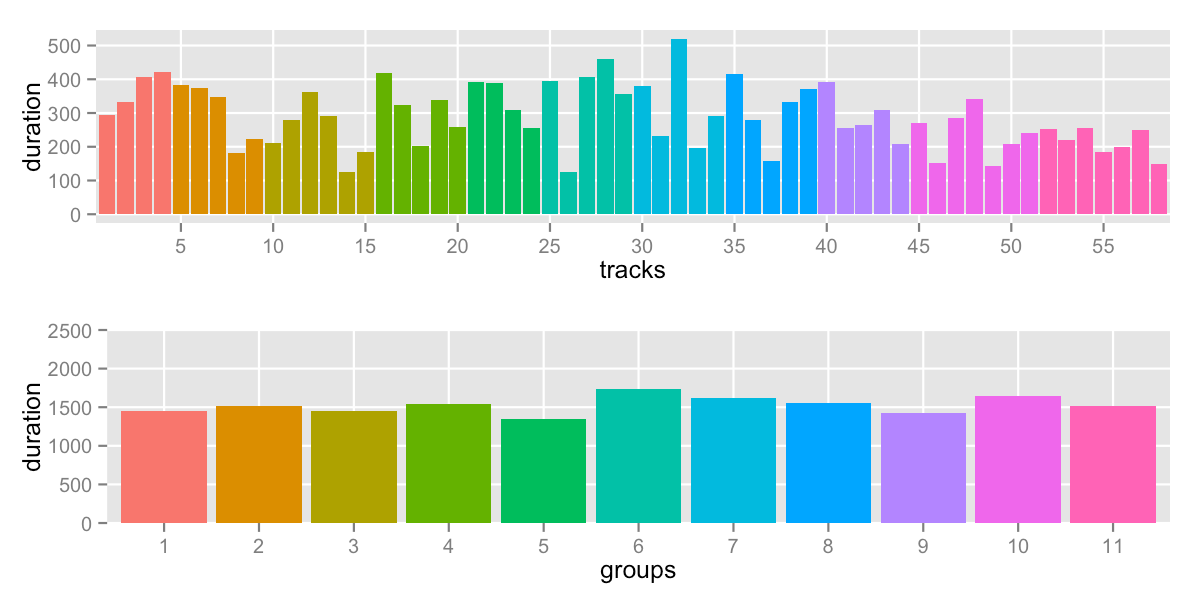
sd: 109.7 -- range: 1348-1740s (22:28-29:00)
This is using the water-flow code. Meanwhile, if you’re curious, the other methods for 11 groups:
    count:     sd = 304.5
    cutoff:    sd = 265.3
    minizinc:  sd = 137.1
Conclusion
Simple problems sometimes have complicated solutions :-)
I don’t intend this to be the final word on the problem. In fact, part of me hopes that I missed something.
Let me know on twitter or by email.