
Using recon_trace with Elixir
This year, I finally got around to learn recon_trace.
With this post, I intend to make your journey smoother and faster than mine.
What is recon_trace?
In my own words:
recon_trace allows you to attach an
IO.inspectto any module/function in a running BEAM, without crashing it
Directly from the documentation:
recon_trace is a module that handles tracing in a safe manner for single Erlang nodes, currently for function calls only.
Why do I need recon_trace?
Is your production system behaving funny? Don’t you wish you had just a bit more logging in a certain module?
With recon_trace, you can:
- see what functions are called, and how often
- see what arguments are passed to a function
- see what a function returns
And while you can’t attach or log inside functions, it’s a great alternative to having nothing.
Installing recon
recon_trace is part of recon. It’s an hex package, so you already know what to do.
Something to keep in mind: adding recon to your project is “free”, because it
doesn’t run anything by default. It will sit there, waiting for you to call it
when you need it.
A recon_trace cheat sheet
This is the template I use to get started:
[
  {Module, :function, :return_trace}
]
|> :recon_trace.calls({100, 1000}, scope: :local)
And to turn off tracing:
:recon_trace.clearWhat makes recon_trace.calls complicated to explain is that each argument is overloaded.
Let’s take each argument, in reverse order: simplest to explain first.
The 3rd argument: options
Straightforward: check options to see everything that’s available.
Buried in there, scope: :local which allows you to trace private functions. That’s useful, so I use it by default.
The 2nd argument: “max”
It’s either a number: n
only log `n` times
Or a rate: {n, m}
only log `n` times per `m` milliseconds
I find the rate to be more flexible, so that’s what I use by default. It keeps logging until I turn it off (or it goes above the rate limit).
The 1st argument: a “spec”
This is something like an MFA.
- 1st: a module name, or
:_for “any module” - 2nd: a function name, or
:_for “any function” - 3rd: “arguments”, which is either:
:_for “any arguments”- a number for a function with a specific arity
:return_trace(see below)- a matchspec
- a lambda
recon_trace will prevent you from doing something crazy like {:_, :_, :_}, which would log everything. This is what makes recon_trace safe.
For a default, I use :return_trace until I need something more specific.
It’s a shortcut to log both the function call with its arguments and the
return value.
Note: :return_trace will log twice, and counts as +2 towards your max.
An Example
[{Enum, :sort, :return_trace}]
|> :recon_trace.calls(10, scope: :local)- what is using
Enum? - show me (exactly)
10calls (because of:return_trace, 5 calls w/ 5 return values) - include private functions (which doesn’t matter in this case)
Annotated:
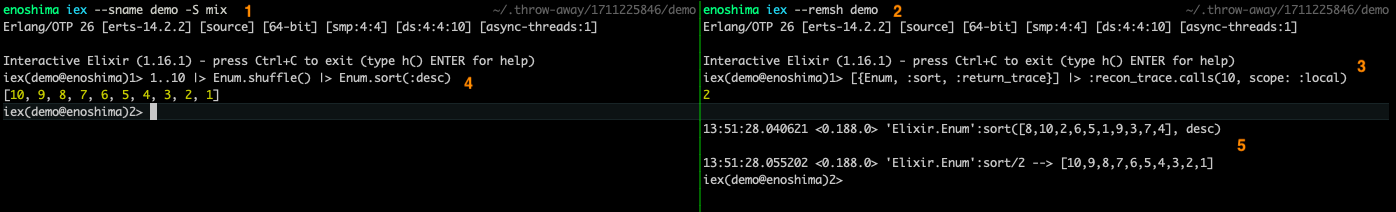 (click to enlarge)
1 start iex for the “live” node
iex --sname demo -S mix2 remote shell into it
iex --remsh demo3 setup tracing
[{Enum, :sort, :return_trace}] |> :recon_trace.calls(10, scope: :local)What is that number 2 that’s returned? That’s the number of functions that
matched and are being traced. 0 usually means you did something wrong, while
other numbers might help in deciding whether you hit what you were targeting.
4 trigger the relevant module/function
1..10 |> Enum.shuffle() |> Enum.sort(:desc)5 observe 2 traces: the invocation and the return value
Going Further
Though I’ve spent some time with :recon_trace, I don’t have all the answers.
Here are some resources to keep going:
- chapter 9 of Stuff Goes Bad: Erlang in Anger
- Erlang-flavored, with some examples
- recon_trace documentation
- overlapping “Erlang in Anger”, but more details in function signatures
- the examples from
calls/3function give you a good idea of what’s possible'_'in Erlang is the same as:_in Elixir
- the code itself
- the ultimate truth