
8 Years of Reading, Visualized
The Data
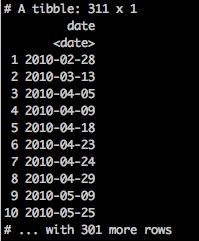
I’ve been keeping track of what I read for years. I occasionally pull the data out and try to see what insights I can extract out of it. The data consists of the date I finished reading a book. There’s one date per book, and some dates have more than one book.
I’ve tried a bunch of summary statistics, various counts and averages, but it wasn’t very enlightening. I wondered what it would look like on different plots.
The Plots
I started with the easiest thing, each event as a dot:
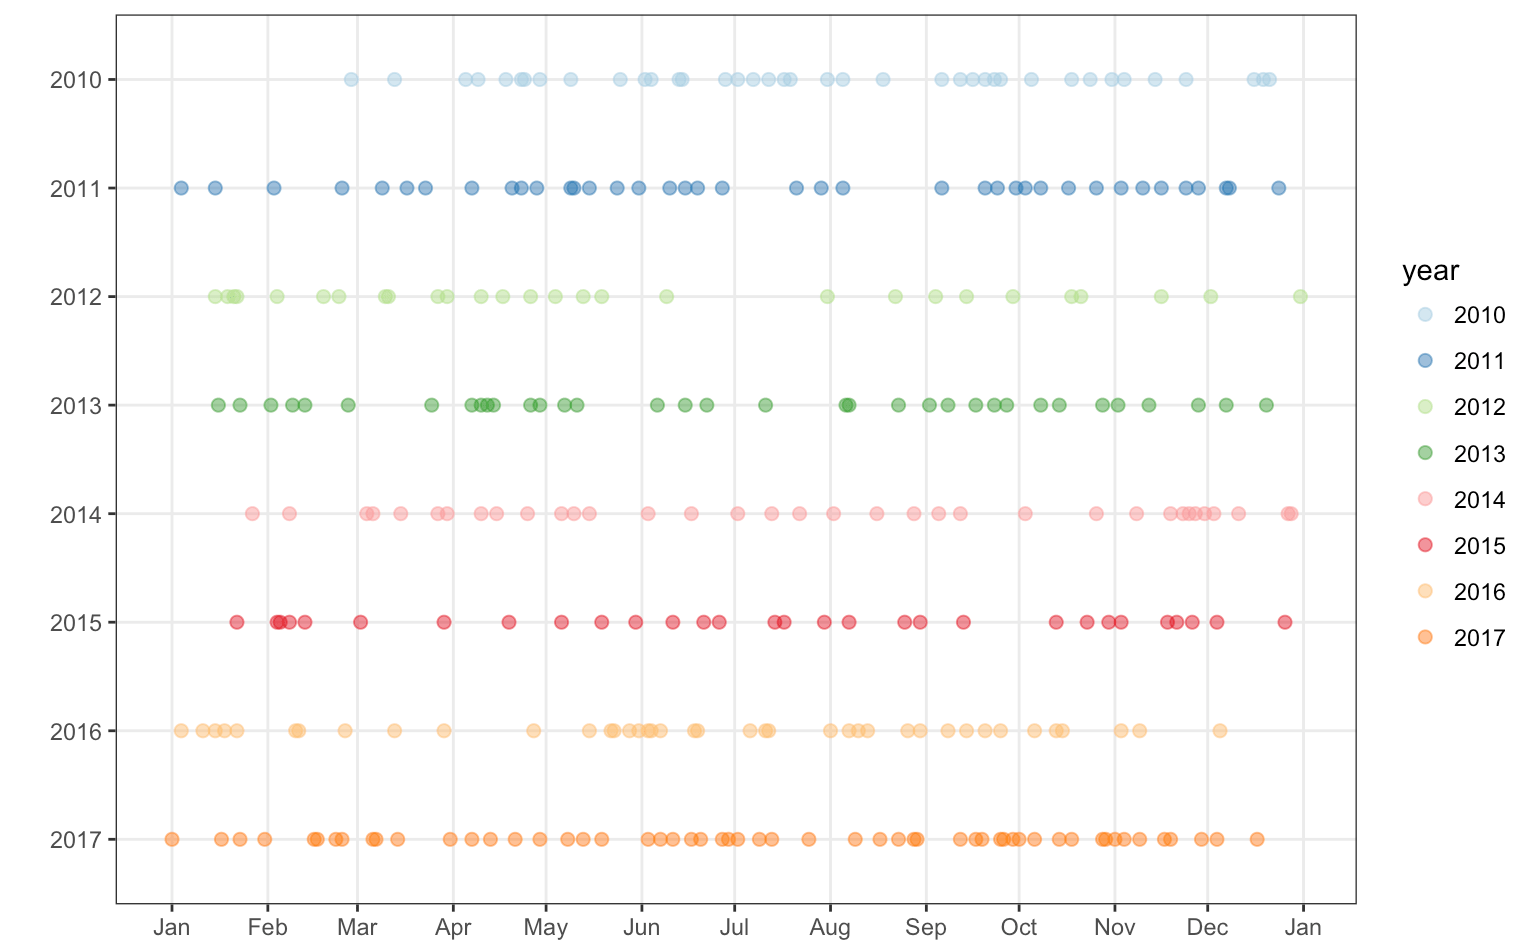
At this level, it’s clear that some periods of time have more/less events happening. I’m also using transparency to reveal overlapping dots. But dots on a timeline makes it hard to interpret progress, let’s make it cumulative:
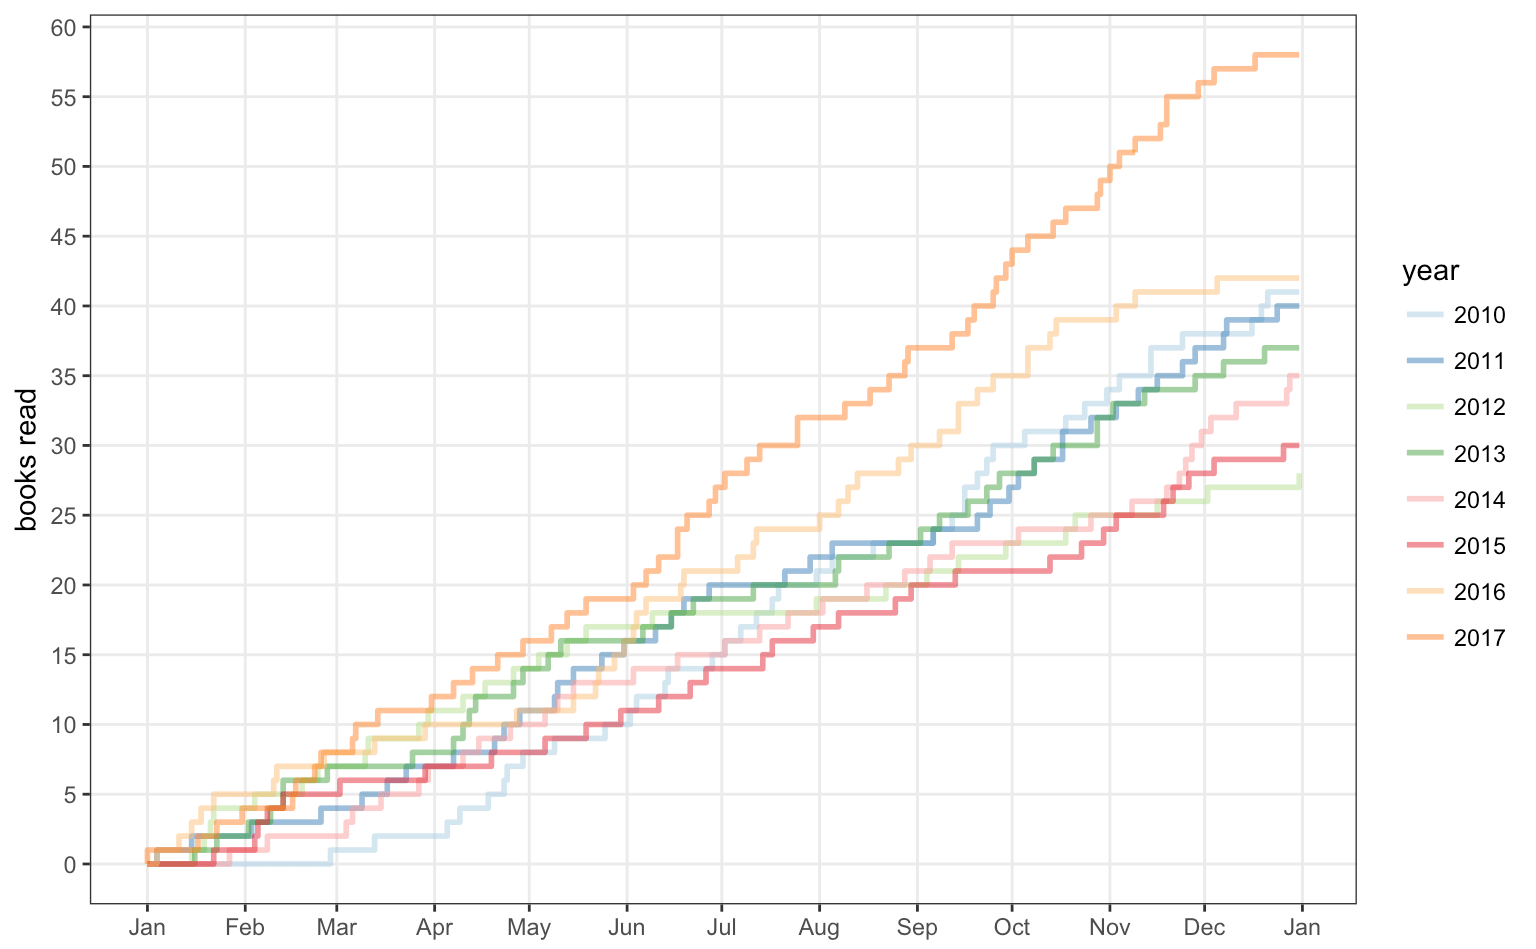
There are a few problems with this. The y-axis doesn’t have a lot of distinct values (there are only so many books I can read in a year), which means a fair bit of overlap between years. Book progression might be more linear, if I’m 60% of the way through a book, that’s 60% of the way to +1. A “line” graph might be fairer:
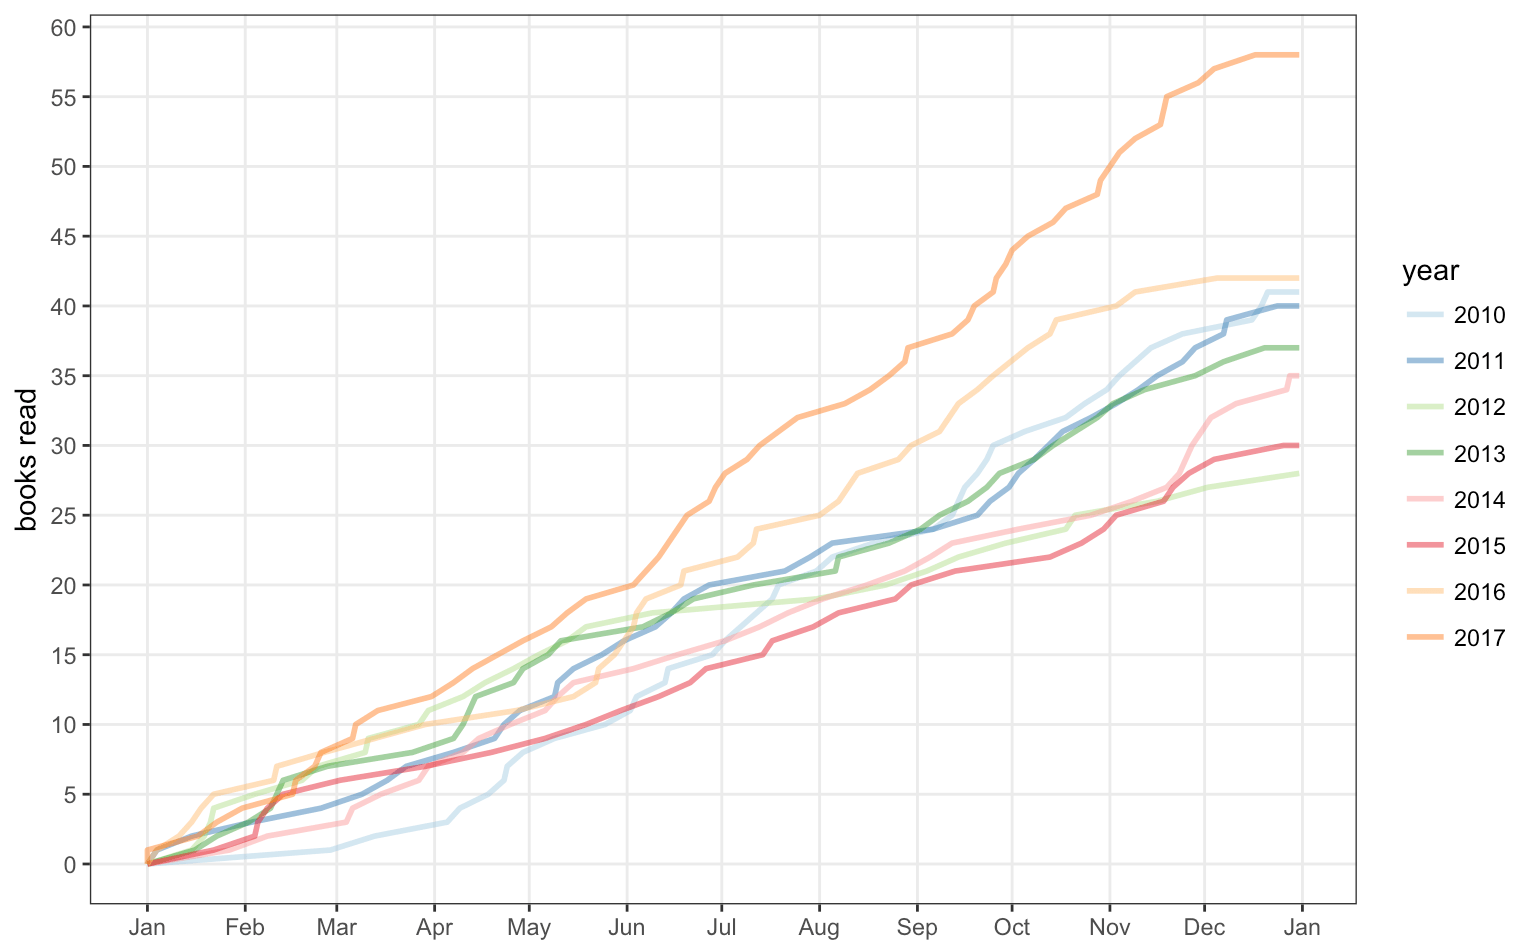
This still suffers from overcrowding in the early months … it all starts at zero and diverges from there. I decided to separate each year:
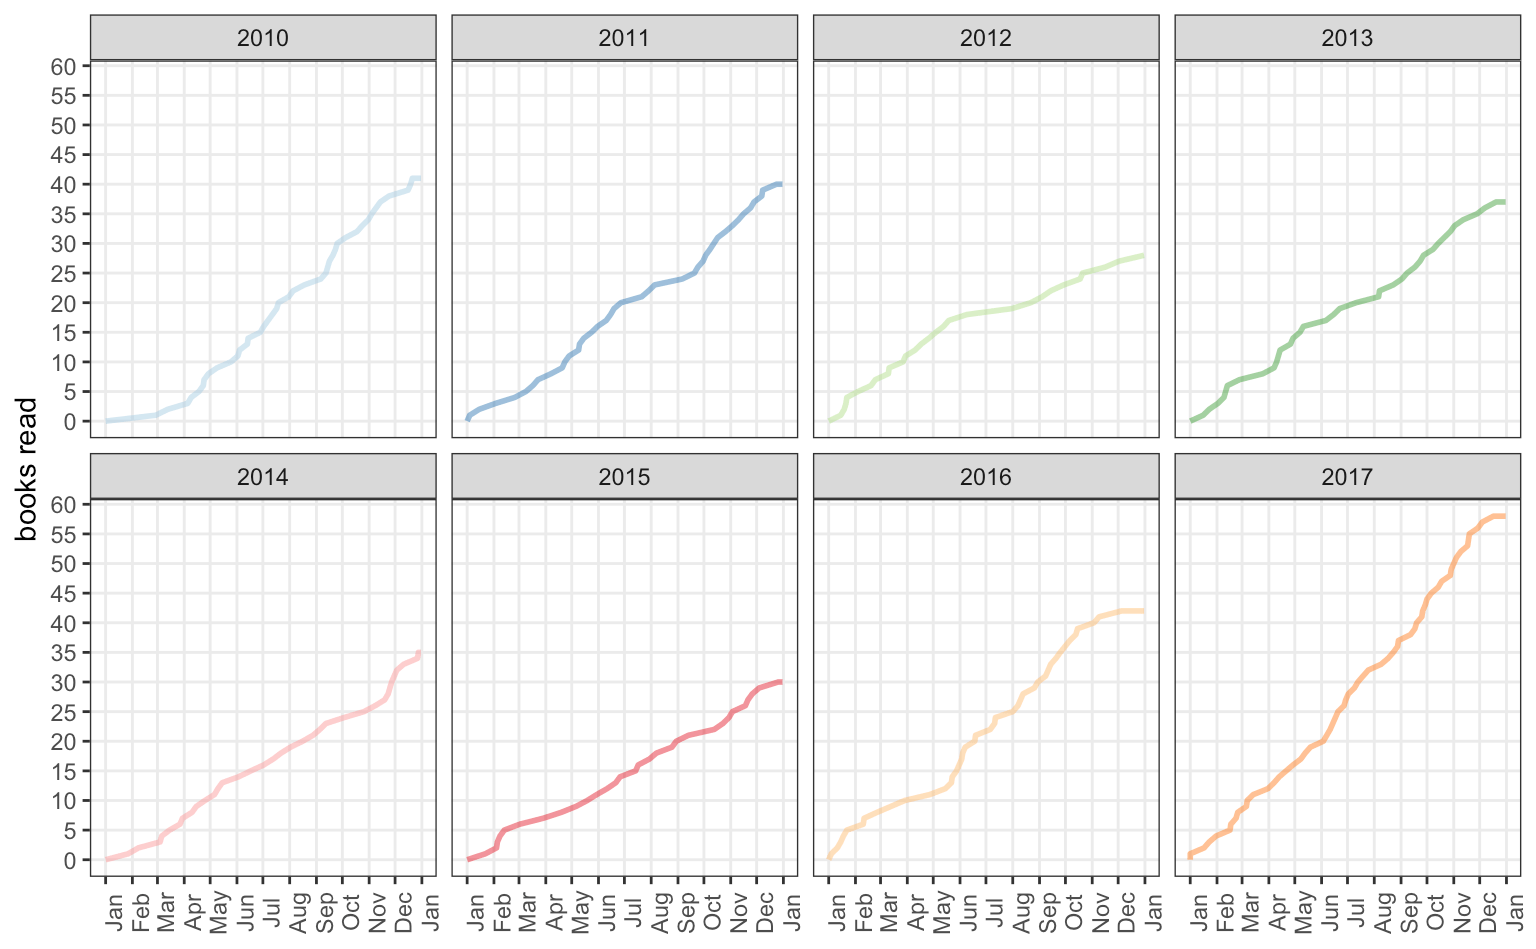
It makes each trend clearer, but it also makes it harder to compare between the years.
Discussion
A “book read” isn’t a great unit of measurement in the first place. What is a book? How many pages does it have? Books come in different sizes with different font sizes and amount of whitespace.
Data-wise, there are a few observations:
- 2017 isn’t like the other years – I’m not sure what I did differently
- the end of each year seems to be flatter than the usual trend
- apart from 2017, other years look similar, especially given the above caveat about the choice of unit
To make date events share the same x-axis, I had to normalize the years so that all dates would share the same year. To ensure that all dates were available, I picked 2016 because it was a leap year.
I also had to create “zero events” on January 1st and December 31st so that charts would be anchored. Without these anchors, the lines would start on the year’s first event and stop on the year’s last event.
All the details are in the R Markdown report.