
How to get Elixir logging with recon_trace
Previously, in Using recon_trace with Elixir, I had laid out a foundation
for using :recon_trace specifically with Elixir.
Since then, I decided to spend some time and “fix” the logging so I wouldn’t have to eyeball-decipher Erlang-flavored dumps.
The problem
Imagine a very simple Pet module
defmodule Pet do
  defstruct [:name, :age, :type]

  def just_cats(pets) do
    pets
    |> Enum.filter(&(&1.type == "cat"))
  end
end
Set up your :recon_trace
[
  {Pet, :just_cats, :return_trace}
]
|> :recon_trace.calls({100, 1000}, scope: :local)
and trigger it
# parenthesis-wrap and :ok return to simplify iex output...
(
  [
    %Pet{name: "Mittens", age: 4, type: "cat"},
    %Pet{name: "Oreo", age: 2, type: "cat"},
    %Pet{name: "Rocky", age: 5, type: "dog"}
  ]
  |> Pet.just_cats()
  :ok
)
here’s a sample output
15:20:49.473527 <0.261.0> 'Elixir.Pet':just_cats([#{name => <<"Mittens">>,type => <<"cat">>,'__struct__' => 'Elixir.Pet',
   age => 4},
 #{name => <<"Oreo">>,type => <<"cat">>,'__struct__' => 'Elixir.Pet',age => 2},
 #{name => <<"Rocky">>,type => <<"dog">>,'__struct__' => 'Elixir.Pet',
   age => 5}])
:ok

15:20:49.473865 <0.261.0> 'Elixir.Pet':just_cats/1 --> [#{name => <<"Mittens">>,type => <<"cat">>,'__struct__' => 'Elixir.Pet',
   age => 4},
 #{name => <<"Oreo">>,type => <<"cat">>,'__struct__' => 'Elixir.Pet',
   age => 2}]
This is workable … but messy-looking. 🤔
The solution
Let’s write a formatter function
require Logger
formatter = fn trace_payload ->
  [:trace, _pid | rest] = trace_payload |> Tuple.to_list()
  rest
  |> inspect()
  |> Logger.debug()
  "~n"
end
(It took me a while to get a formatter that I was happy with, and I’ll dig deeper in the next section.)
Hook up your formatter during the :recon_trace setup
[
  {Pet, :just_cats, :return_trace}
]
|> :recon_trace.calls({100, 1000}, scope: :local, formatter: formatter)
Trigger it (same as above). Here’s the output now
15:35:04.920 [debug] [:call, {Pet, :just_cats, [[%Pet{name: "Mittens", age: 4, type: "cat"}, %Pet{name: "Oreo", age: 2, type: "cat"}, %Pet{name: "Rocky", age: 5, type: "dog"}]]}]
:ok

15:35:04.920 [debug] [:return_from, {Pet, :just_cats, 1}, [%Pet{name: "Mittens", age: 4, type: "cat"}, %Pet{name: "Oreo", age: 2, type: "cat"}]]
The more structs and strings you have, the more you will benefit for Elixir-aware inspect().
Discussion
Digging into recon’s code, the default formatter is quite something
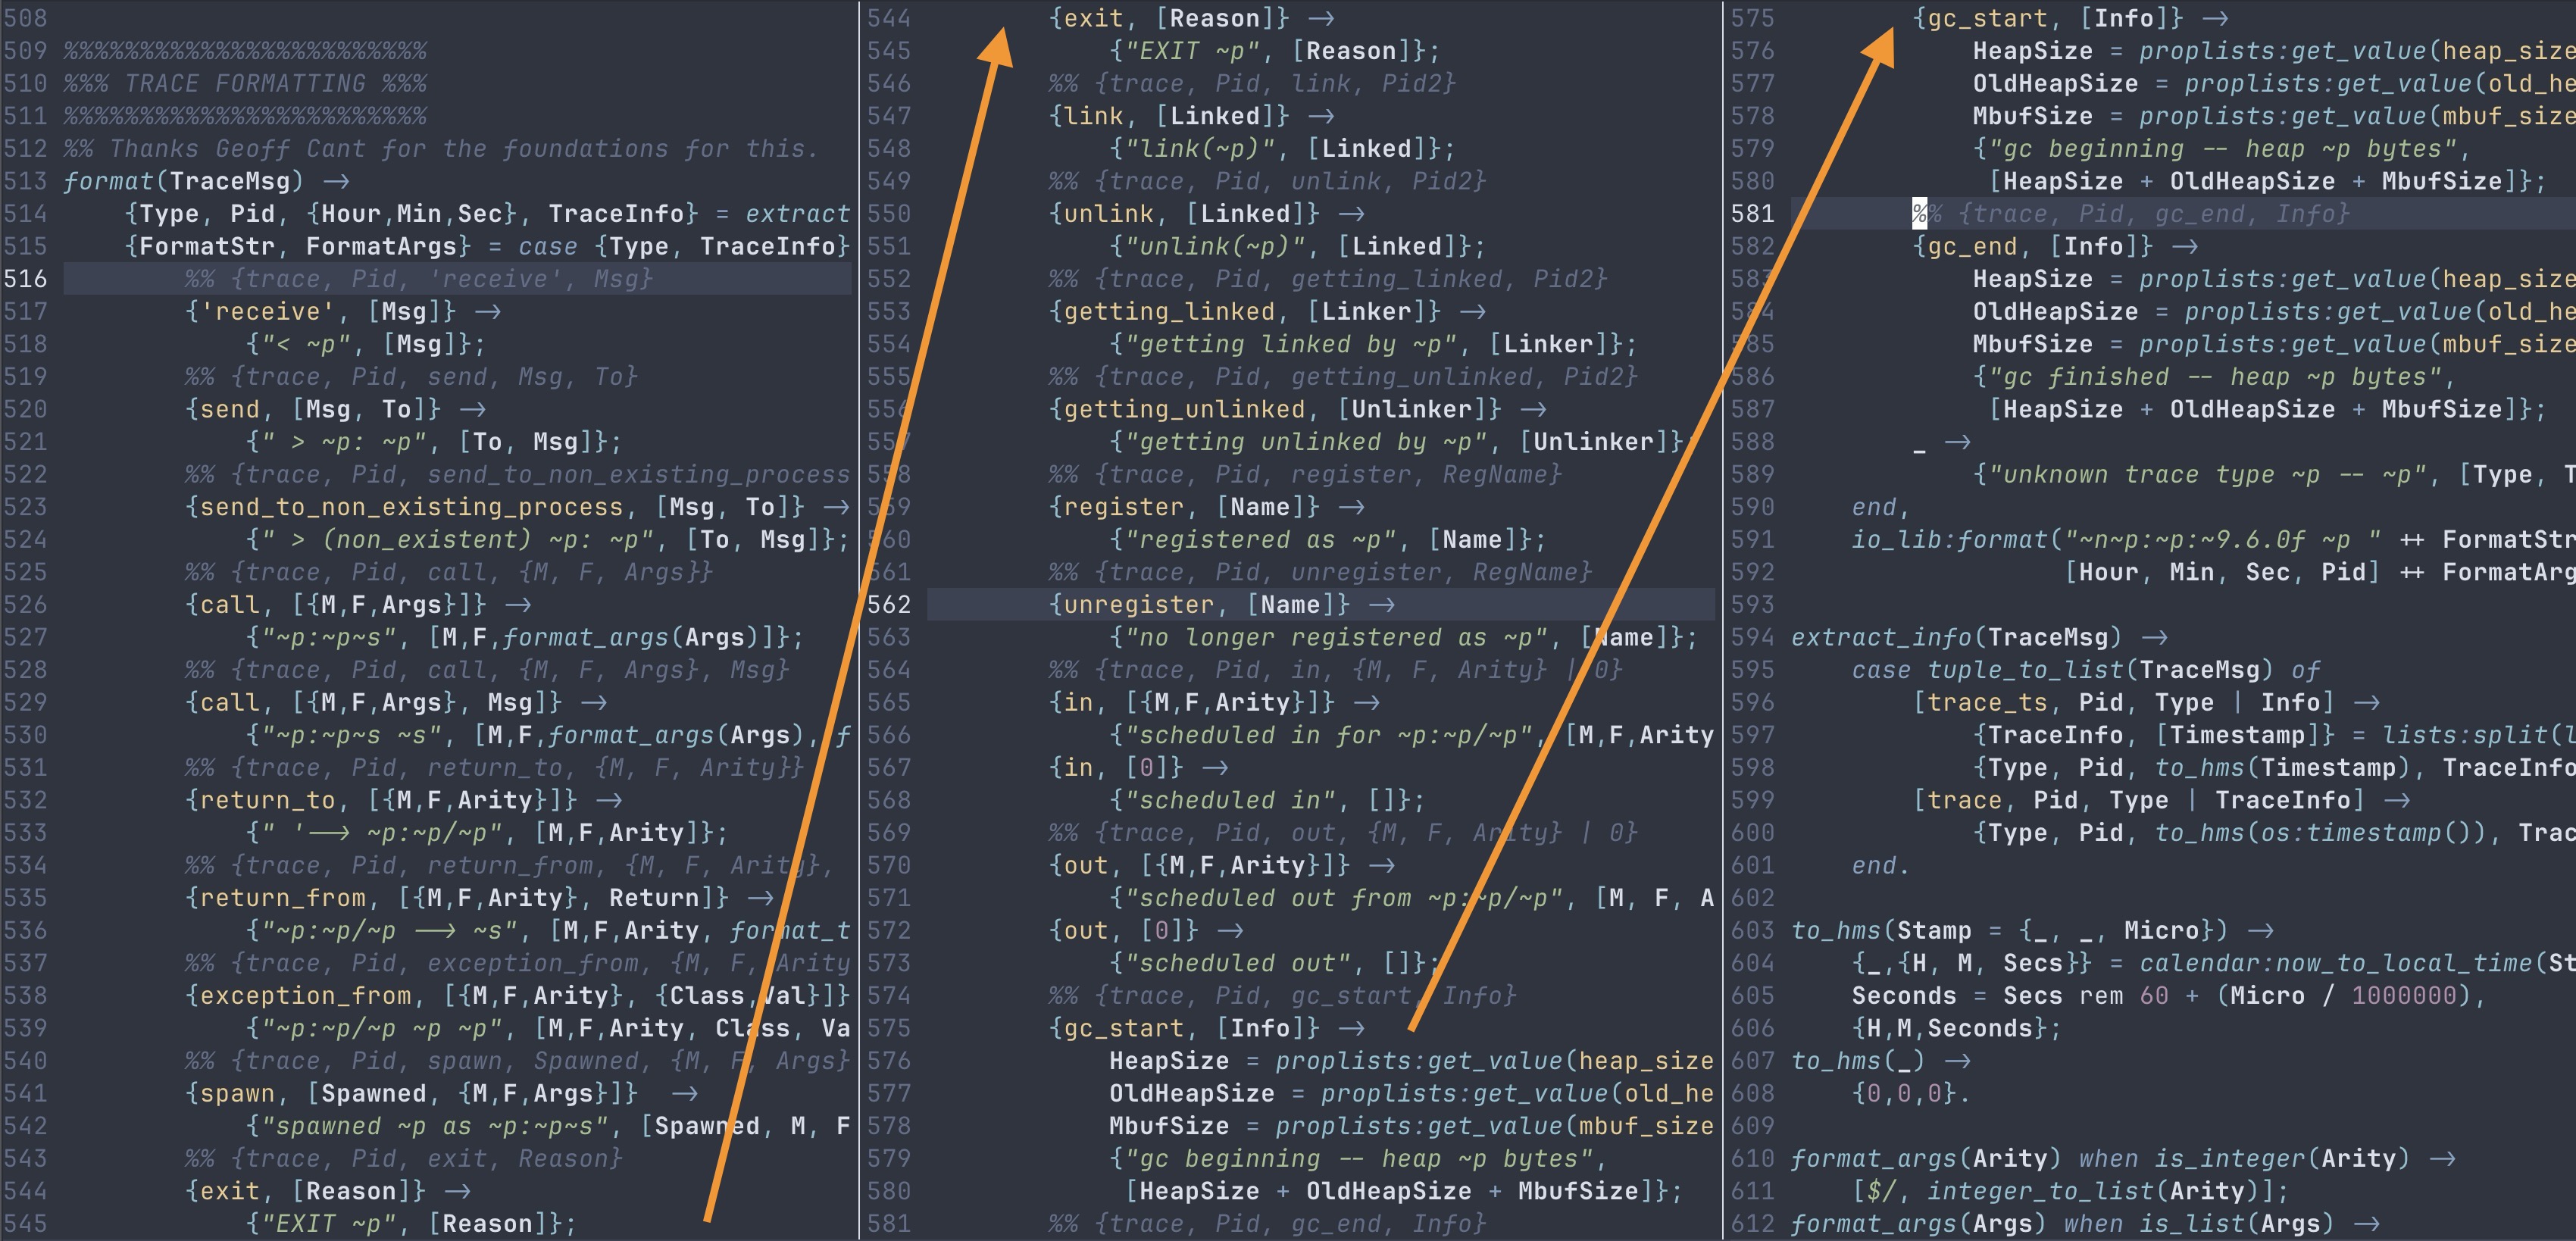
It stands at 80 lines, without counting its helpers. Long-story short:
- yes: this code attempts to make sense of the
TraceMsg, and extract/format them into something useful - but: personally, I haven’t needed to untangle these details, so I’m fine dumping something a bit more raw
- you might get different number of items in the
TraceMsgtuple, which is whatextract_infofocuses on – but, again, I’m fine with dumping it raw
extract_info(TraceMsg) ->
    case tuple_to_list(TraceMsg) of
        [trace_ts, Pid, Type | Info] ->
            {TraceInfo, [Timestamp]} = lists:split(length(Info)-1, Info),
            {Type, Pid, to_hms(Timestamp), TraceInfo};
        [trace, Pid, Type | TraceInfo] ->
            {Type, Pid, to_hms(os:timestamp()), TraceInfo}
    end.
Revisiting my formatter
require Logger
formatter = fn trace_payload ->
  [:trace, _pid | rest] = trace_payload |> Tuple.to_list()
  rest
  |> inspect()
  |> Logger.debug()
  "~n"
end
Tuple.to_list()- keep everything after the
pid, whatever it is- I wasn’t interested in the
pid, but you might be
- I wasn’t interested in the
- lean on
inspect() - send to
Logger - return “~n” to satisfy
:recon_trace
Overtime
Now that you are fully in charge of HOW things are logged, you could ALSO be in charge of WHAT gets logged.
If you feel like pulling things apart and adding conditionals and filters, you can absolutely do that.
But keep in mind that you’re paying-as-you-go, possibly on a production system. If you are going to do something costly, you might end up hurting yourself. So, PLEASE use responsibly.
There are, after all, many ways to set more conservative filters during
the :recon_trace initialization. Refer to the documentation as needed.